

Industrial conglomerate Crane (NYSE:CR) reported Q1 CY2025 results exceeding the market’s revenue expectations, with sales up 9.3% year on year to $557.6 million. Its non-GAAP profit of $1.39 per share was 6.5% above analysts’ consensus estimates.
Is now the time to buy Crane? Find out by accessing our full research report, it’s free.
Crane (CR) Q1 CY2025 Highlights:
- Revenue: $557.6 million vs analyst estimates of $549.1 million (9.3% year-on-year growth, 1.5% beat)
- Adjusted EPS: $1.39 vs analyst estimates of $1.31 (6.5% beat)
- Adjusted EBITDA: $115.9 million vs analyst estimates of $114.9 million (20.8% margin, 0.9% beat)
- Management reiterated its full-year Adjusted EPS guidance of $5.45 at the midpoint
- Operating Margin: 18.1%, up from 15.9% in the same quarter last year
- Free Cash Flow was -$60.4 million compared to -$89 million in the same quarter last year
- Organic Revenue rose 7.5% year on year (5% in the same quarter last year)
- Market Capitalization: $8.55 billion
Max Mitchell, Crane's Chairman, President and Chief Executive Officer, stated: "We delivered a very strong start to 2025, with exceptional results in the first quarter of 24.1% adjusted EPS growth driven by 7.5% core sales growth and strong operating leverage. Furthermore, demand trends across our strategic growth platforms were solid in the quarter, with 15.6% year-over-year core order growth and 12.1% year-over-year core backlog growth."
Company Overview
Based in Connecticut, Crane (NYSE:CR) is a diversified manufacturer of engineered industrial products, including fluid handling, and aerospace technologies.
Sales Growth
A company’s long-term sales performance is one signal of its overall quality. Any business can put up a good quarter or two, but many enduring ones grow for years. Over the last five years, Crane’s demand was weak and its revenue declined by 7.7% per year. This wasn’t a great result and suggests it’s a low quality business.
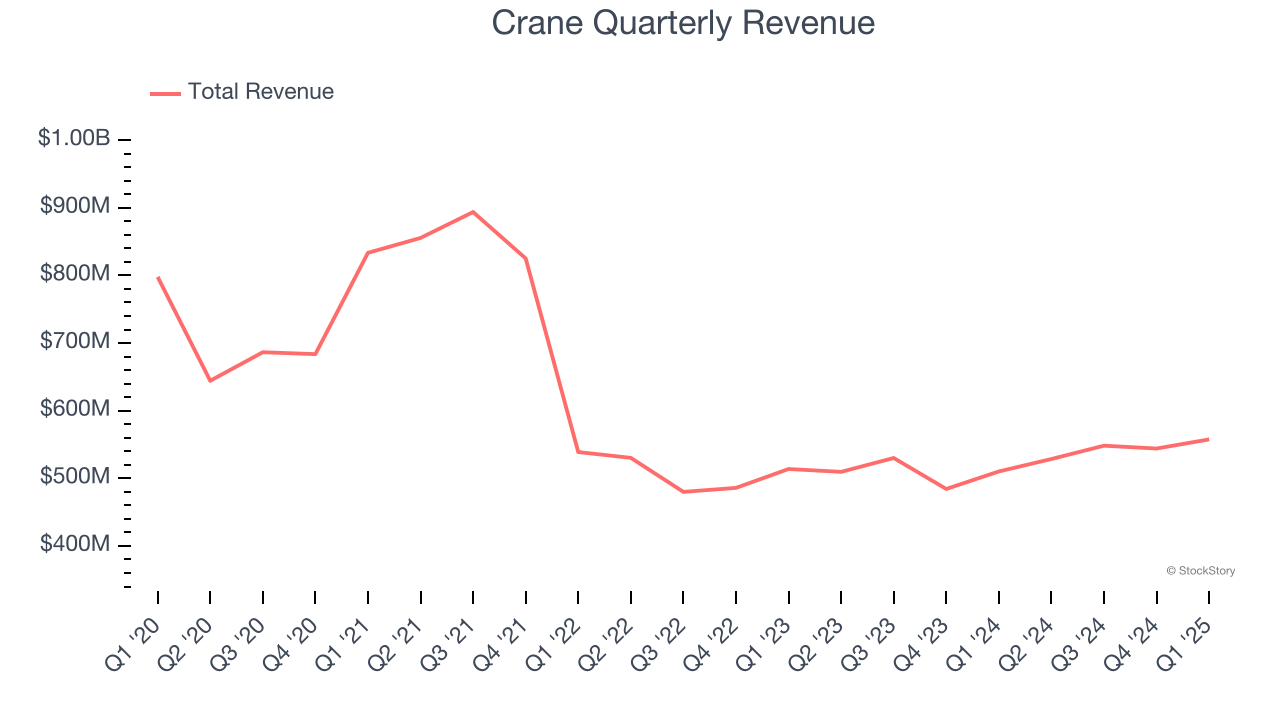
We at StockStory place the most emphasis on long-term growth, but within industrials, a half-decade historical view may miss cycles, industry trends, or a company capitalizing on catalysts such as a new contract win or a successful product line. Crane’s annualized revenue growth of 4.1% over the last two years is above its five-year trend, but we were still disappointed by the results. 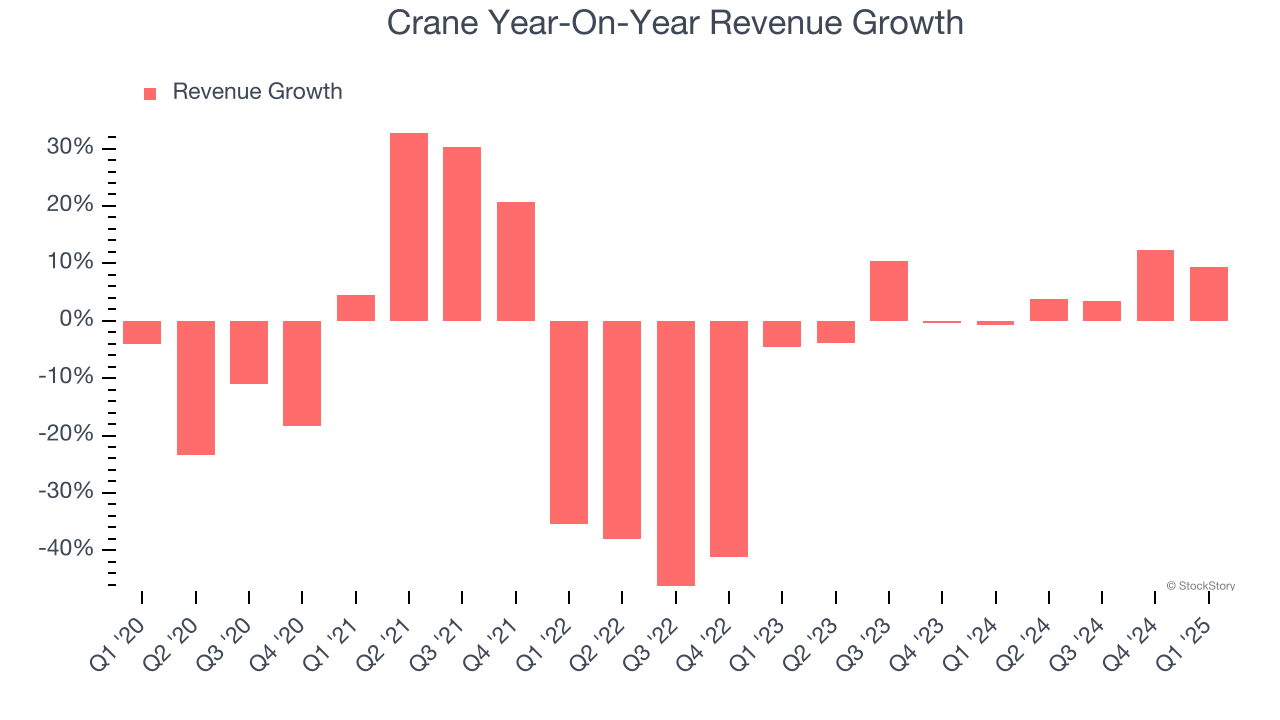
We can dig further into the company’s sales dynamics by analyzing its organic revenue, which strips out one-time events like acquisitions and currency fluctuations that don’t accurately reflect its fundamentals. Over the last two years, Crane’s organic revenue averaged 6.8% year-on-year growth. Because this number is better than its normal revenue growth, we can see that some mixture of divestitures and foreign exchange rates dampened its headline results. 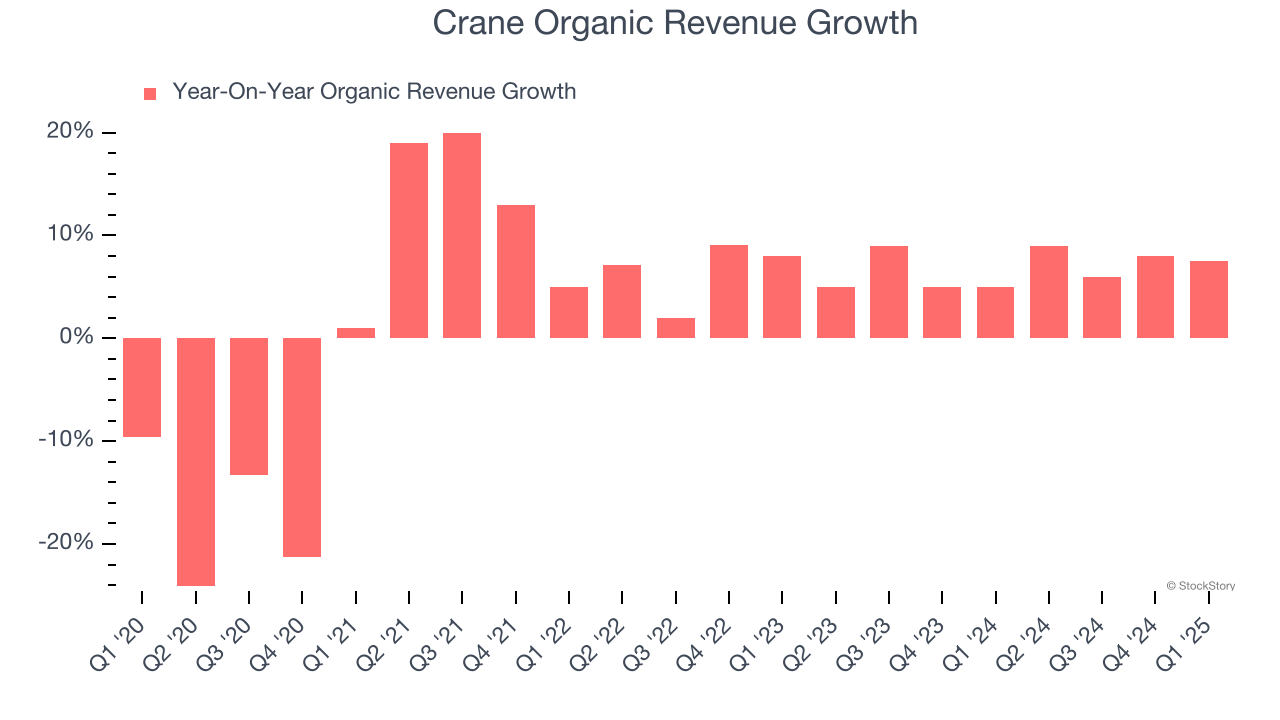
This quarter, Crane reported year-on-year revenue growth of 9.3%, and its $557.6 million of revenue exceeded Wall Street’s estimates by 1.5%.
Looking ahead, sell-side analysts expect revenue to grow 5.1% over the next 12 months, similar to its two-year rate. Although this projection implies its newer products and services will catalyze better top-line performance, it is still below the sector average.
Here at StockStory, we certainly understand the potential of thematic investing. Diverse winners from Microsoft (MSFT) to Alphabet (GOOG), Coca-Cola (KO) to Monster Beverage (MNST) could all have been identified as promising growth stories with a megatrend driving the growth. So, in that spirit, we’ve identified a relatively under-the-radar profitable growth stock benefiting from the rise of AI, available to you FREE via this link.
Operating Margin
Operating margin is a key measure of profitability. Think of it as net income - the bottom line - excluding the impact of taxes and interest on debt, which are less connected to business fundamentals.
Crane has been an efficient company over the last five years. It was one of the more profitable businesses in the industrials sector, boasting an average operating margin of 12%. This result isn’t surprising as its high gross margin gives it a favorable starting point.
Analyzing the trend in its profitability, Crane’s operating margin rose by 6.8 percentage points over the last five years, showing its efficiency has meaningfully improved.
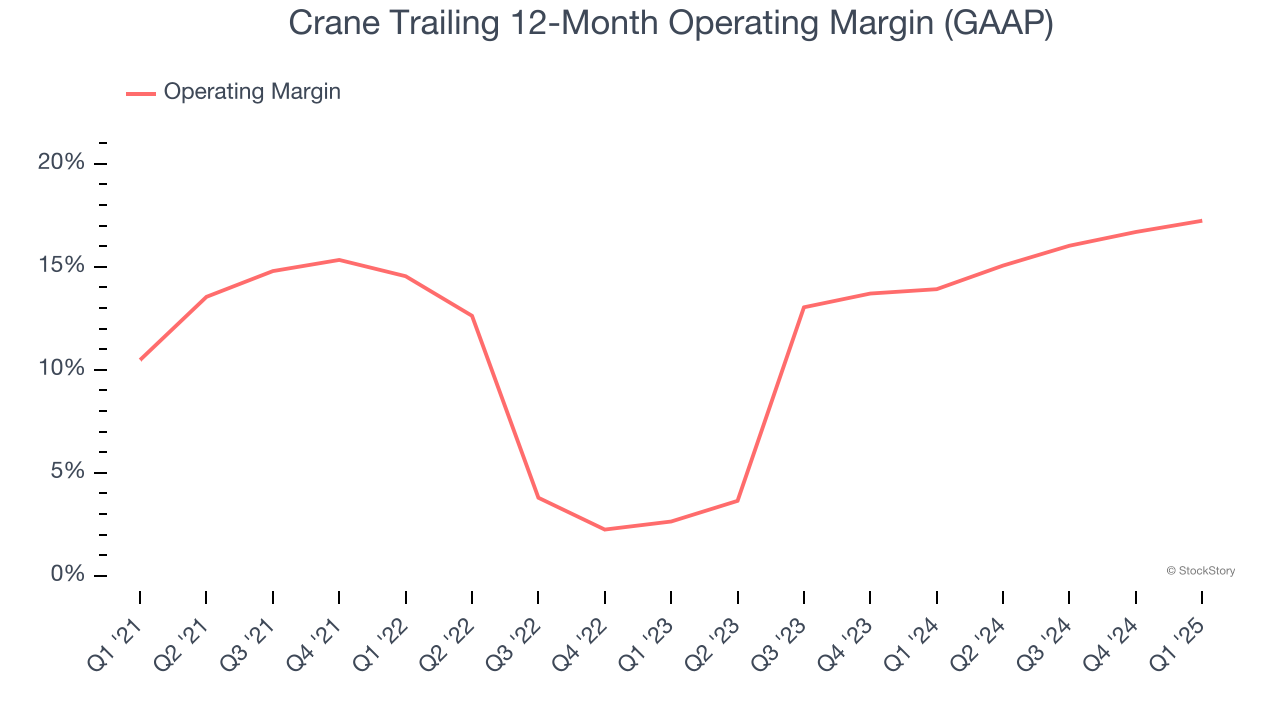
This quarter, Crane generated an operating profit margin of 18.1%, up 2.2 percentage points year on year. Since its gross margin expanded more than its operating margin, we can infer that leverage on its cost of sales was the primary driver behind the recently higher efficiency.
Earnings Per Share
We track the long-term change in earnings per share (EPS) for the same reason as long-term revenue growth. Compared to revenue, however, EPS highlights whether a company’s growth is profitable.
Sadly for Crane, its EPS and revenue declined by 2.1% and 7.7% annually over the last five years. We tend to steer our readers away from companies with falling revenue and EPS, where diminishing earnings could imply changing secular trends and preferences. If the tide turns unexpectedly, Crane’s low margin of safety could leave its stock price susceptible to large downswings.
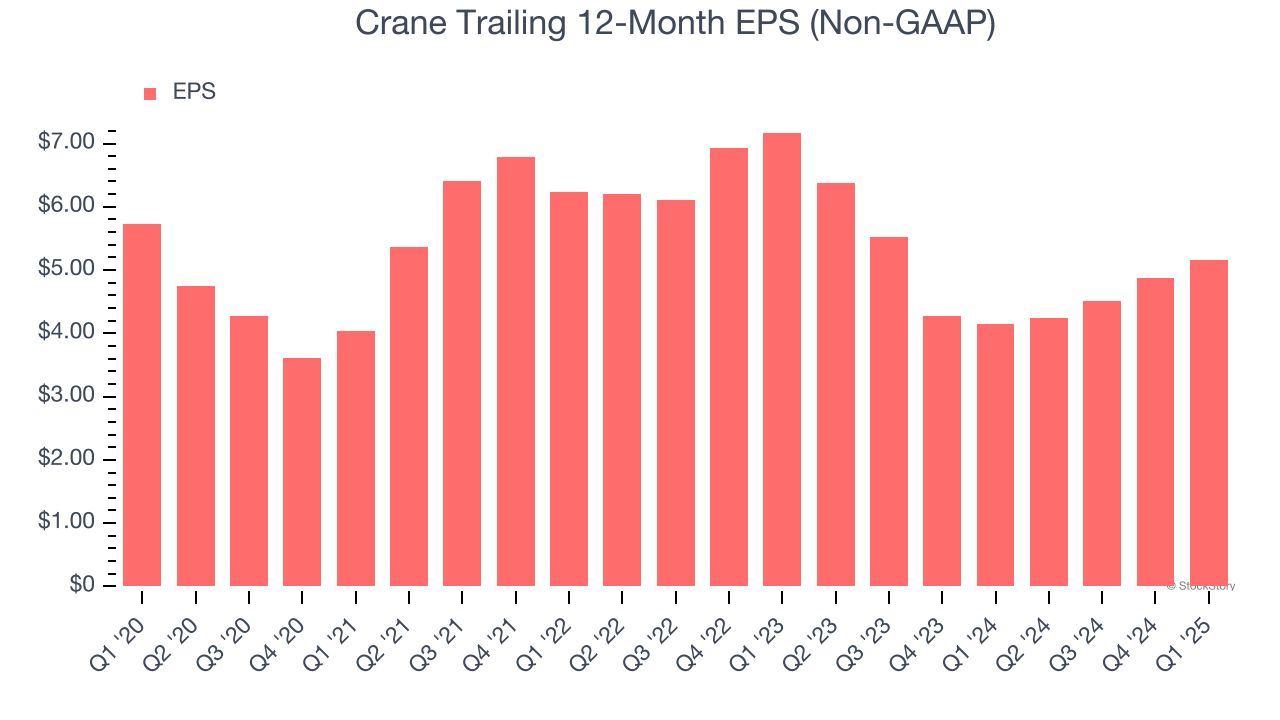
Like with revenue, we analyze EPS over a shorter period to see if we are missing a change in the business.
For Crane, its two-year annual EPS declines of 15.3% show it’s continued to underperform. These results were bad no matter how you slice the data.
In Q1, Crane reported EPS at $1.39, up from $1.12 in the same quarter last year. This print beat analysts’ estimates by 6.5%. Over the next 12 months, Wall Street expects Crane’s full-year EPS of $5.15 to grow 10%.
Key Takeaways from Crane’s Q1 Results
We enjoyed seeing Crane beat analysts’ organic revenue, EPS, and EBITDA expectations this quarter. On the other hand, its full-year EPS guidance slightly missed. Still, this quarter had some key positives. The stock remained flat at $148.67 immediately after reporting.
Sure, Crane had a solid quarter, but if we look at the bigger picture, is this stock a buy? The latest quarter does matter, but not nearly as much as longer-term fundamentals and valuation, when deciding if the stock is a buy. We cover that in our actionable full research report which you can read here, it’s free.